Constructs an igraph graph where vertices are TCR clones and edges
connect clones within a distance threshold. Edge weights encode similarity
via exponential decay: exp(-distance / scale).
Usage
compute_tcr_network(
  tcrs,
  organism = NULL,
  threshold = NULL,
  dist_matrix = NULL,
  scale = NULL,
  min_edges = 0L,
  jitter = TRUE,
  layout = "fr",
  seed = NULL
)
Arguments
- tcrs
Data.frame with TCR columns (
va,cdr3a,vb,cdr3b). All columns are attached as vertex attributes on the output graph.- organism
Character string (
"human"or"mouse"). Ignored whendist_matrixis provided.- threshold
Numeric or
NULL. Maximum TCRdist for an edge. IfNULL, auto-detected from the distance distribution valley.- dist_matrix
Optional precomputed N x N distance matrix (e.g. from
tcrdist_matrix()orTCRrep@paired_dist). If provided,organismis ignored and distances are taken from this matrix.- scale
Numeric or
NULL. Scale parameter for the similarity transformexp(-dist / scale). IfNULL, defaults tothreshold / 4.- min_edges
Integer. Minimum number of edges a vertex must have to be kept.
0(default) keeps all vertices.1removes singletons (isolated nodes),2removes vertices with fewer than 2 edges, etc.- jitter
Logical. If
TRUE(default), slightly offset overlapping nodes (e.g. identical clones with distance 0) so they are individually visible instead of stacking on top of each other.- layout
Character. Layout algorithm:
"fr"(Fruchterman-Reingold),"kk"(Kamada-Kawai),"drl","circle", or"grid". Default"fr".- seed
Integer or
NULL. Random seed for layout reproducibility.
Value
A named list with elements:
graphAn
igraphobject. Vertex attributes include all columns fromtcrs. Edge attributes:weight(similarity) anddistance(TCRdist).layoutNumeric matrix (N x 2) of layout coordinates.
thresholdNumeric. Threshold used.
scaleNumeric. Scale parameter used.
n_componentsInteger. Number of connected components.
n_edgesInteger. Number of edges in the graph.
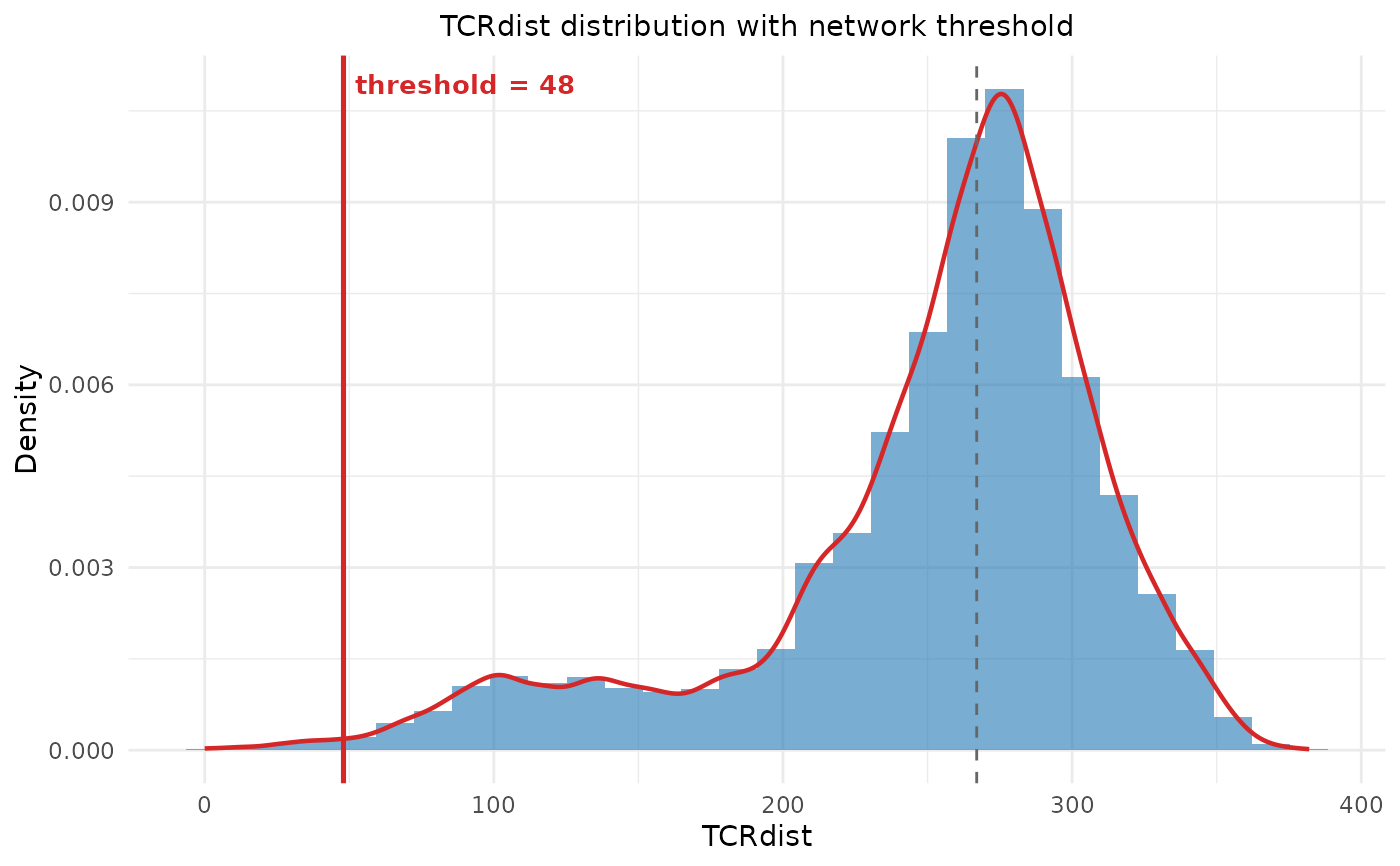
dist_plotggplotobject showing the distance distribution with the threshold line, orNULLif ggplot2 is not available.
Details
When threshold = NULL, the threshold is auto-detected by finding the
valley between the two peaks of the (typically bimodal) TCRdist
distribution, using kernel density estimation on a subsample.
A distance distribution plot with the threshold marked is automatically
displayed when ggplot2 is available. The plot is also stored in the
returned list as dist_plot.
Examples
# \donttest{
data(dash)
sub <- dash[1:200, ]
net <- compute_tcr_network(sub, "mouse", threshold = 48, seed = 42)

net$n_components
#> [1] 146
net$n_edges
#> [1] 108
# }
net$n_components
#> [1] 146
net$n_edges
#> [1] 108
# }